
How one estimates sleep stages
You sleep a lot. It's not unlikely that you also track your sleep, whether with a watch, ring, or mattress pad. But how do these pieces of technology know? How do they turn heart rate and movement into distinct stages? Give me some time and I'll explain.
Note: I've worked with sleep data intermittently. This is just the first time I decided to write about it.
Gathering materials
To collect training data, we can track sleep in a process called polysomnography, where:
- The subject goes to a sleep clinic
-
Many wires are attached to the patient, measuring many things:
- EEG (brain waves)
- EOG (eye movements)
- EMG (muscle activity)
- ECG (heart rate)
- Respiratory effort
- Pulse oximetry
- The patient sleeps
- A technologist watches the data and splits it into sleep stages
Now we have stages marked by times, and we just need to predict them. For our purposes, our inputs will be accelerometer data, heart data, and the time.
Becoming something of a technologist myself
I read a lot of papers but the best one was Motion and heart rate from a wrist-worn wearable and labeled sleep from polysomnography, because it has data. It was collected from Apple Watches and cross referenced with polysomnography, and the data's open to view. Let me show you some so you can get an intuition too.
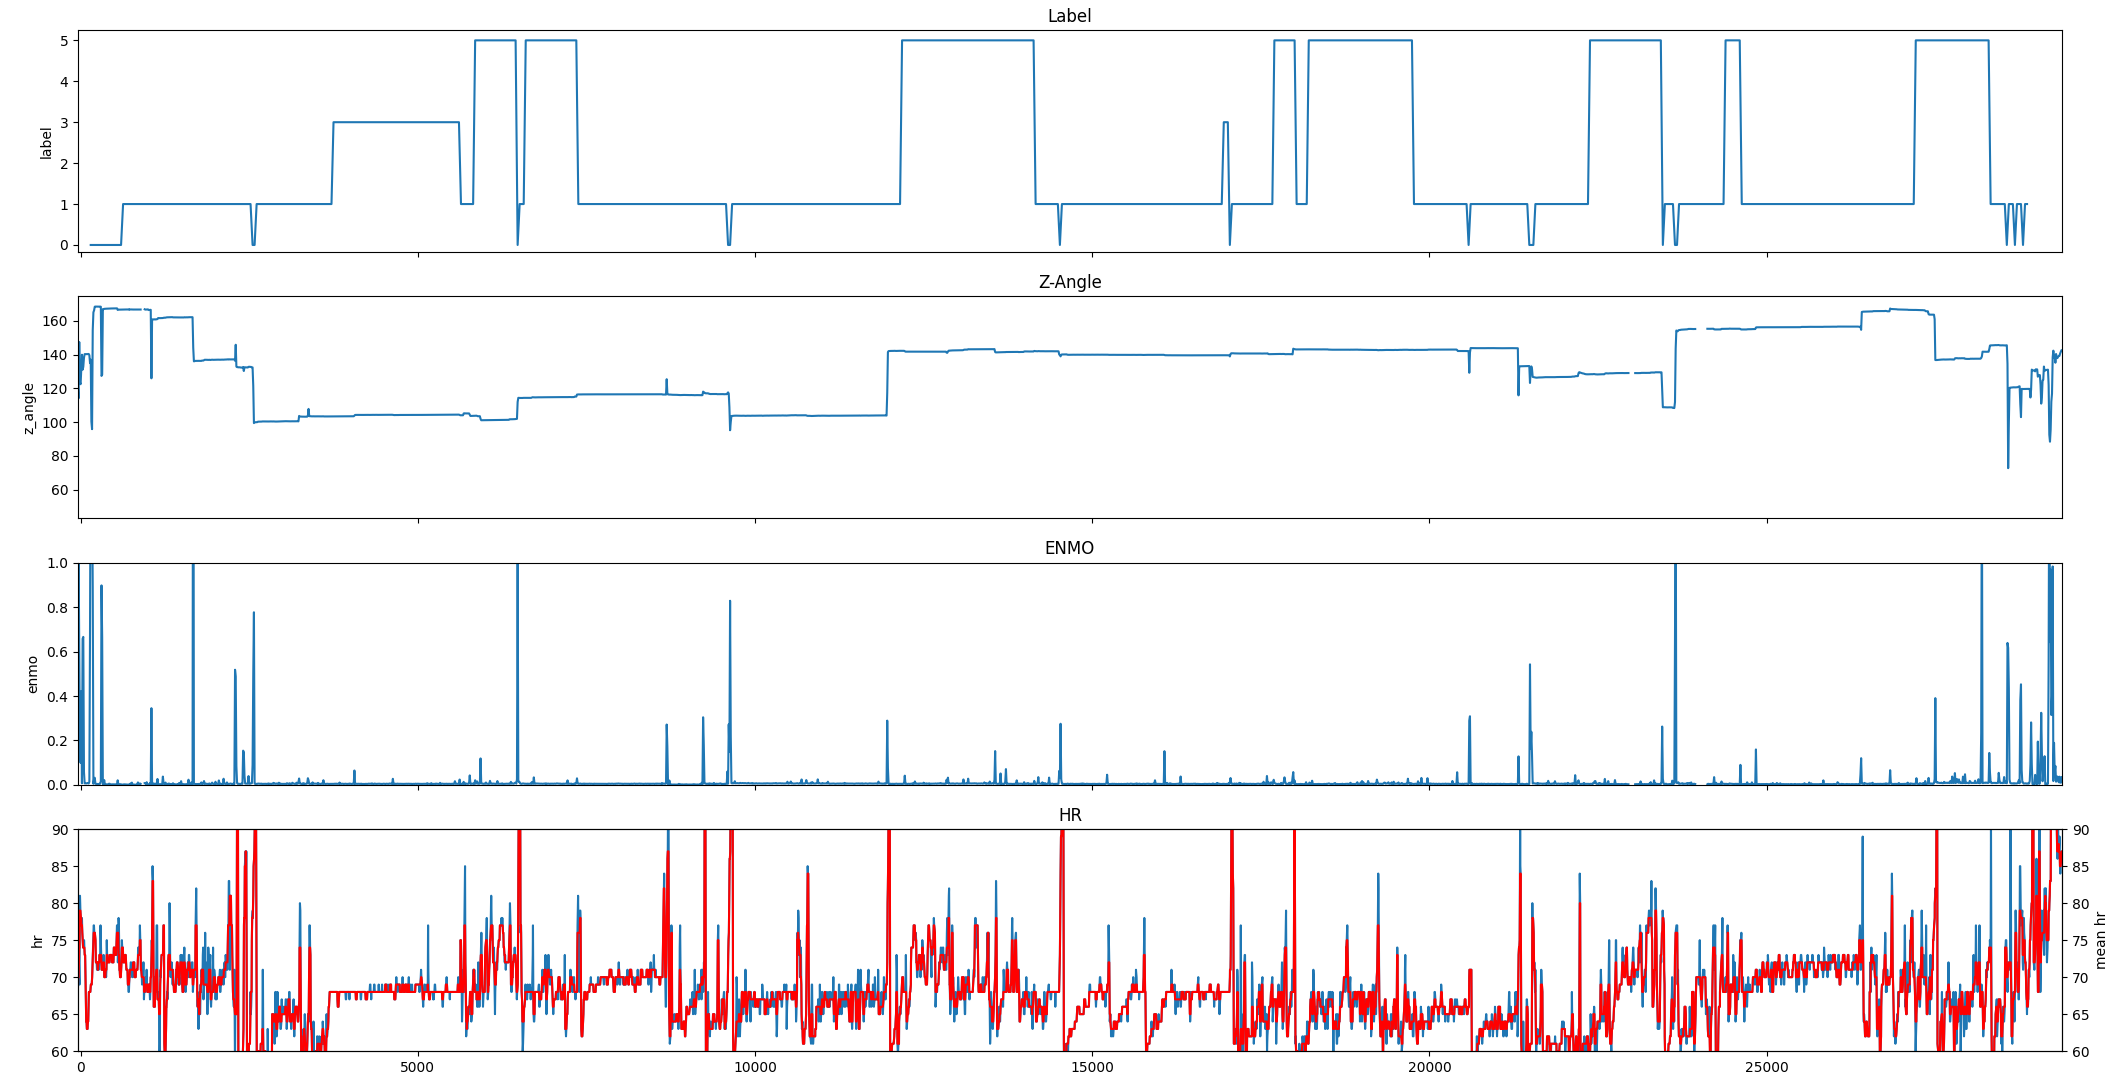
We start with a view of the sleep stages (called a hypnogram). We have sleep cycles every 90 minutes or so, or 4-6 times a night. More info:
| Sleep Stage | HR | HRV | Movement | When |
|---|---|---|---|---|
| Awake (0) | Higher | Variable | Frequent | ~2.5%; beginning/end of/throughout sleep |
| Light sleep (1, N2) | Moderately lower | Moderate | Occasional | ~55%; throughout the night |
| Deep sleep (3, N3) | Lowest | Highest | Minimal | ~20%; predominantly early |
| REM sleep (5) | Irregular, can spike | Depends | Very little except for twitches | ~22.5%; more frequent toward morning |
The middle panels show accelerometer data: the 10 second max ENMO (euclidian norm minus 1) and mean Z angle (calculated from the Z acceleration). The bottom panel displays heart data, where the red line has a mean filter applied.
This is enough data to predict wake/sleep reasonably well - you can clearly see when they start and stop sleeping from just ENMO. However, while you could guess the specific stages using general knowledge, you wouldn't be very accurate. Let me look at some different data with different metrics.
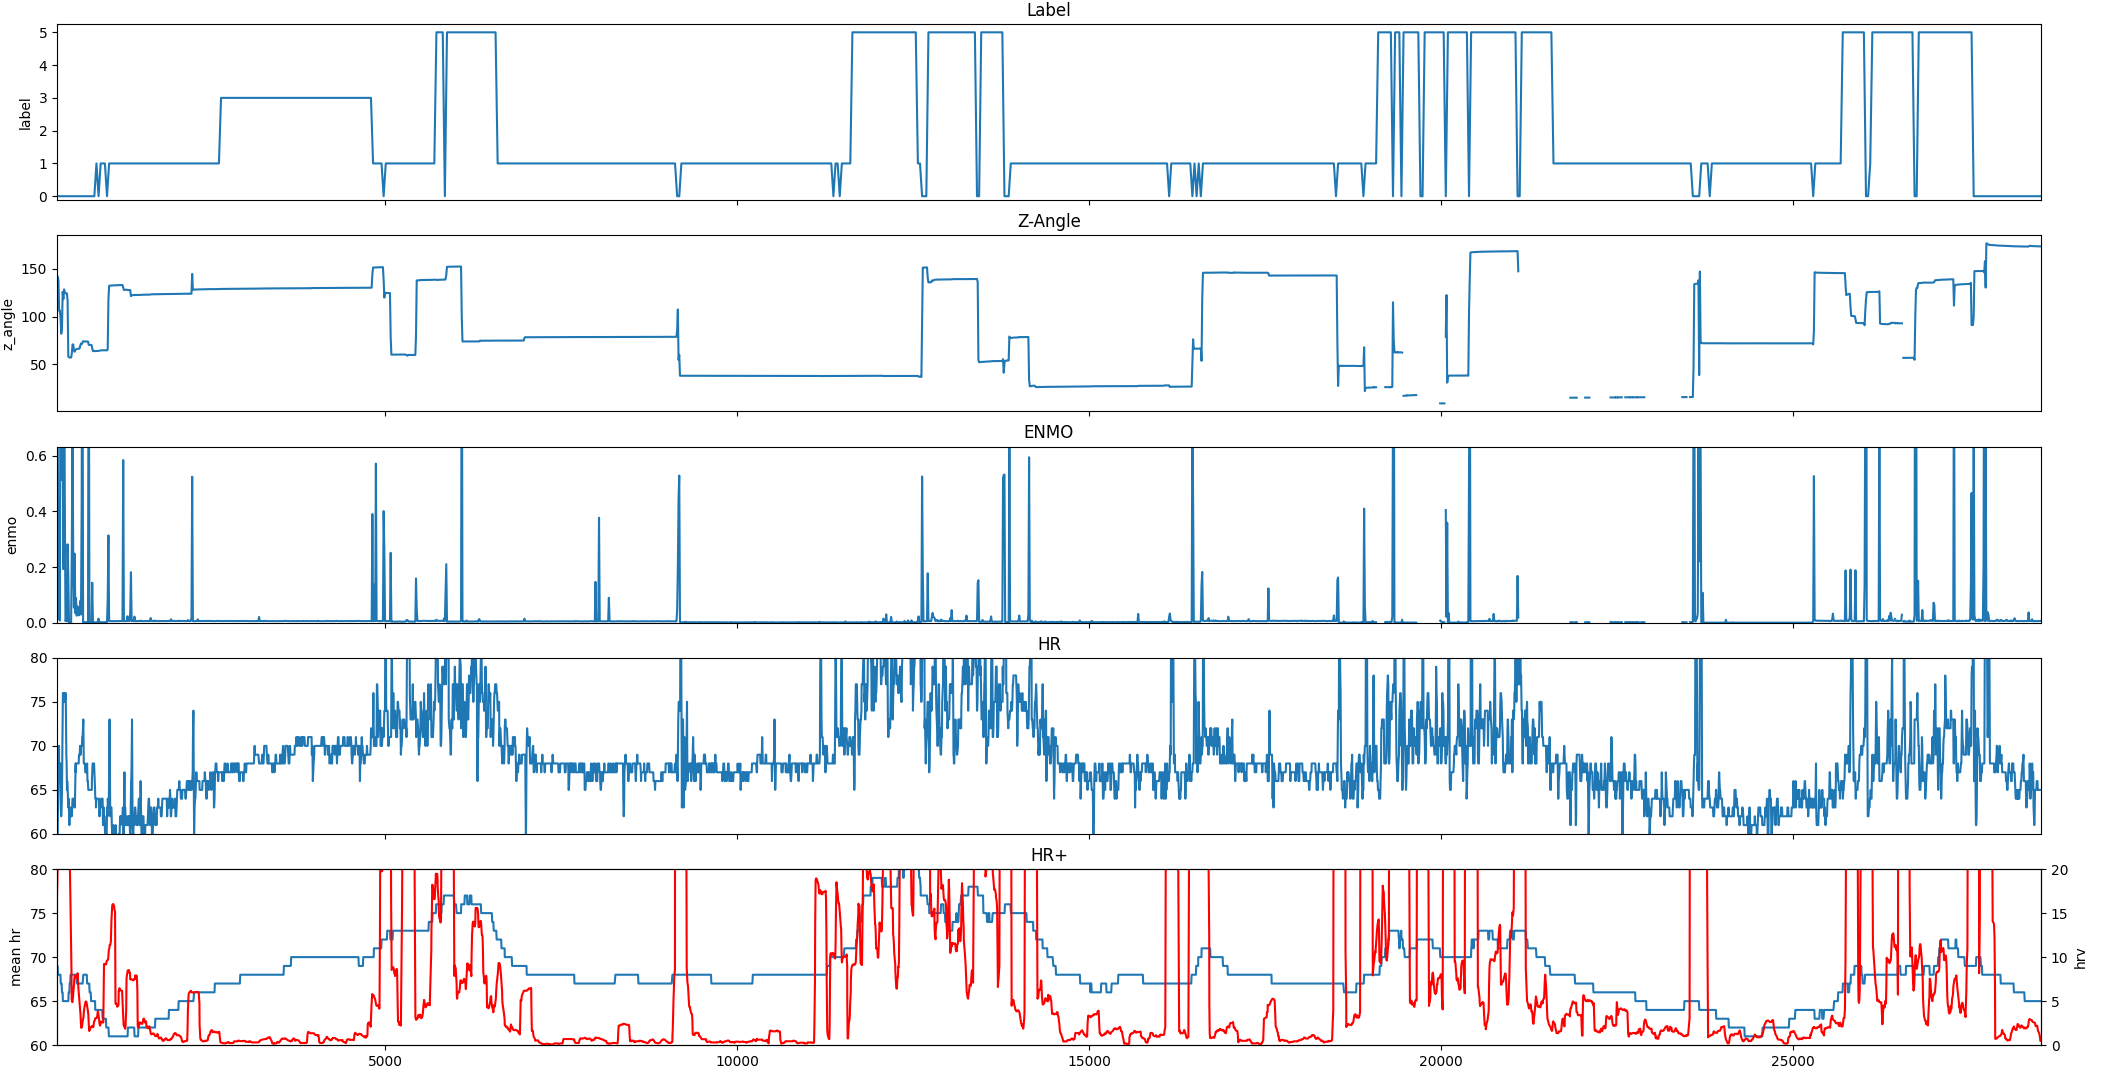
This is much more interesting! You can see:
- How you can predict wake from accelerometer and clock data
- How you can predict deep sleep from HRV and clock data
- How you can predict REM from HRV and clock data
But you can also see how hard it is to predict things:
- ENMO spikes sometimes indicate wakefulness but sometimes don't
- Deep sleep doesn't seem to consistently be caused by low HR or HRV
- Stages sometimes change before or after you would expect them to
And this is a best case scenario. A lot of the other data is even more confusing.
Reading my own data
I've collected data from a custom Bangle.JS app, and it's time to figure out when I'm in light, deep, or REM sleep. This is my first time doing this - Sleep as Android was always inaccurate and I've never owned something with built in sleep tracking.
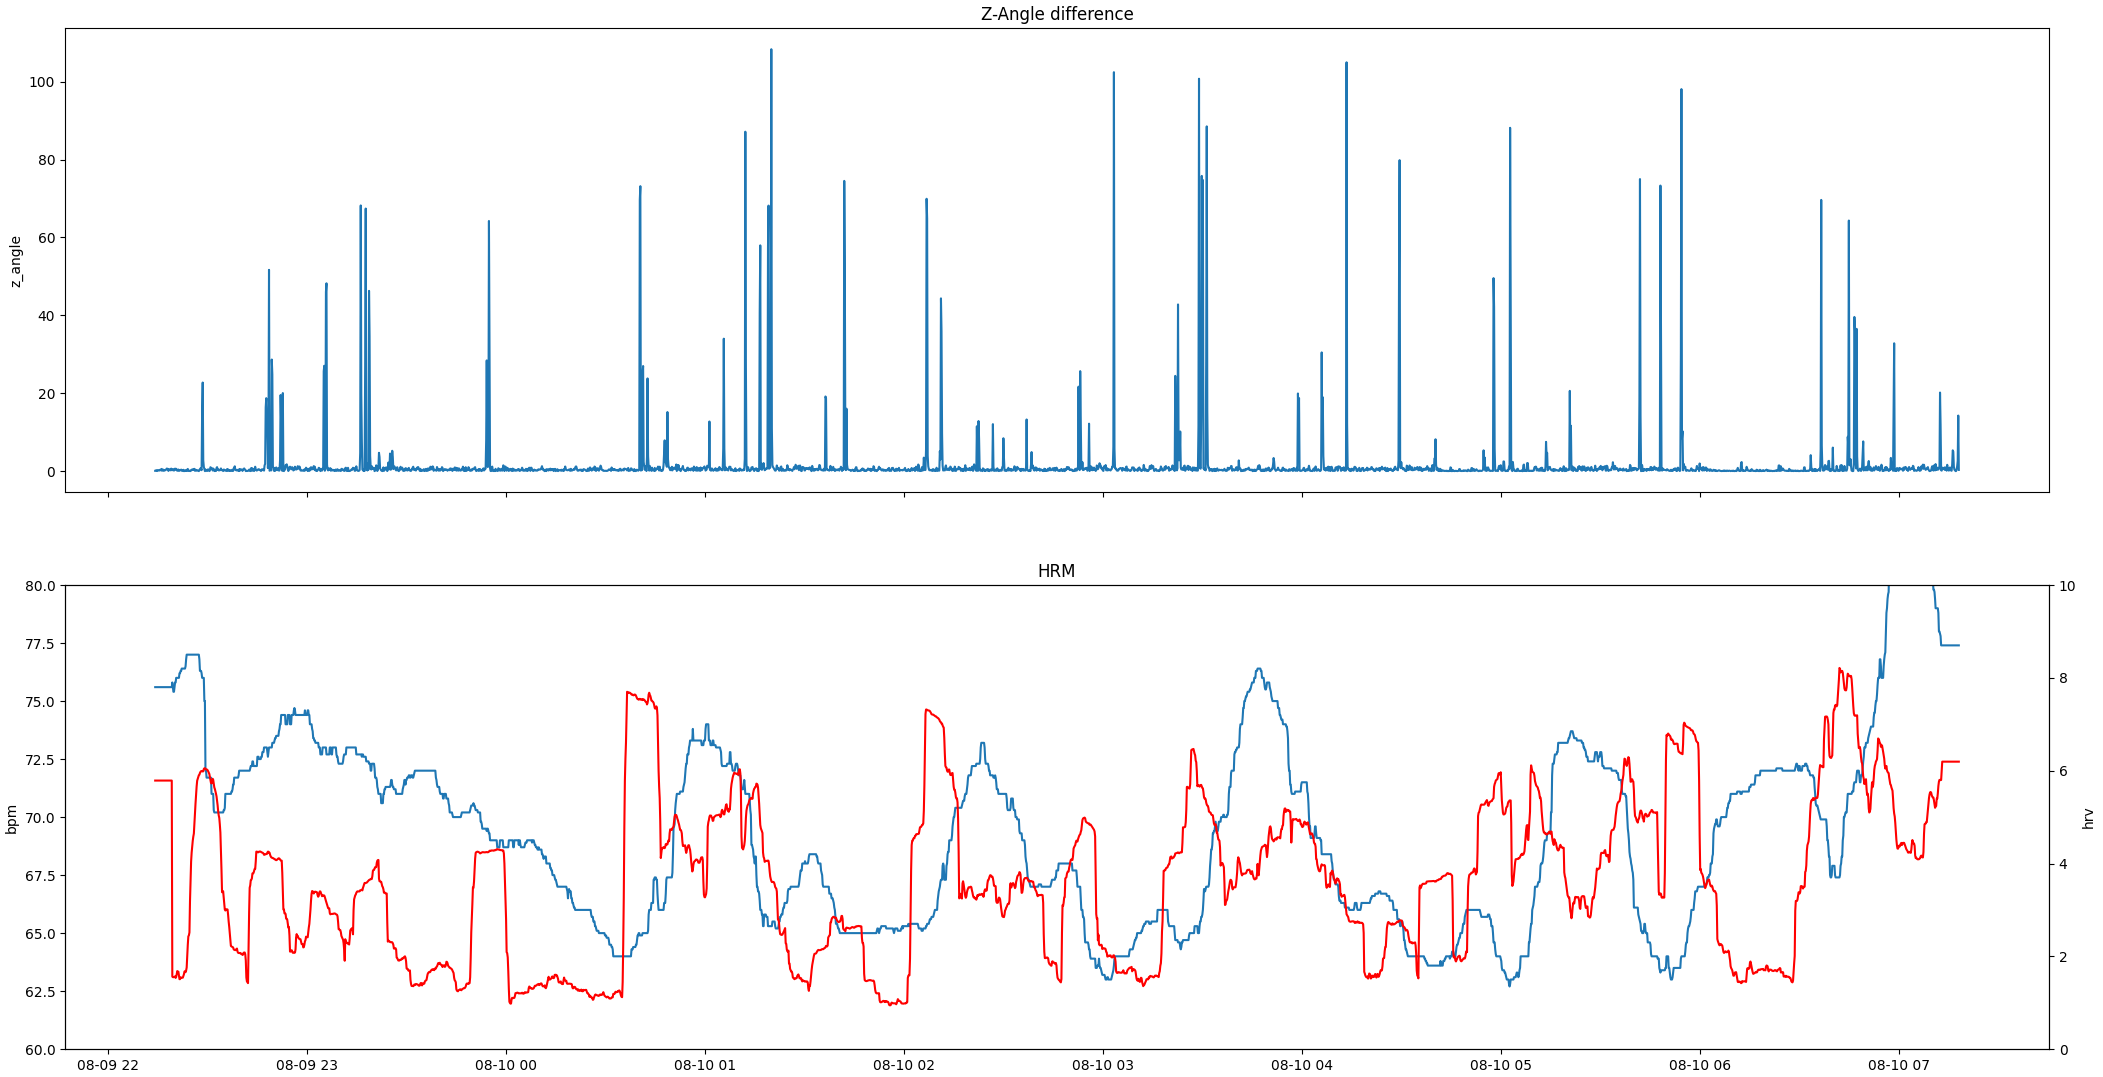
We can see some distinct cycles. Cool! I specifically see the following ones:
- Still trying to sleep until 23:00
- Deep sleep cycle from 0:00-0:40
- REM from 0:40-1:20
- REM from 2:00-2:40
- REM from 3:20-4:10
- REM from 4:50-6:10
- REM from 6:30
- Waking up from 6:50
But I hope you've learned that it's not easy to predict sleep cycles.